
I’ve been writing about GEO and AEO for a while now – the idea that as AI systems like ChatGPT, Gemini, and Google’s AI Mode become the first place people go for answers, visibility in those systems matters as much as visibility in traditional search.
But measuring it is harder than it sounds. You can’t just check a dashboard. You have to actually ask the questions your potential readers or customers would ask, across multiple platforms, and record what comes back. Then do it again next week. And the week after.
So I built a system to do that automatically. I called it Klara (such a great book!).
What Klara actually does
Every night, Klara runs as an autonomous AI agent. It opens a browser, runs a set of queries across Google and Google’s AI Mode, records whether my content appears, takes screenshots as evidence, and saves everything to CSV files. Then it analyses the results and emails me a briefing.
That much is the mechanical part. What makes it interesting is the data that feeds into the analysis – because the visibility data alone doesn’t tell you much without context.
The data pipeline
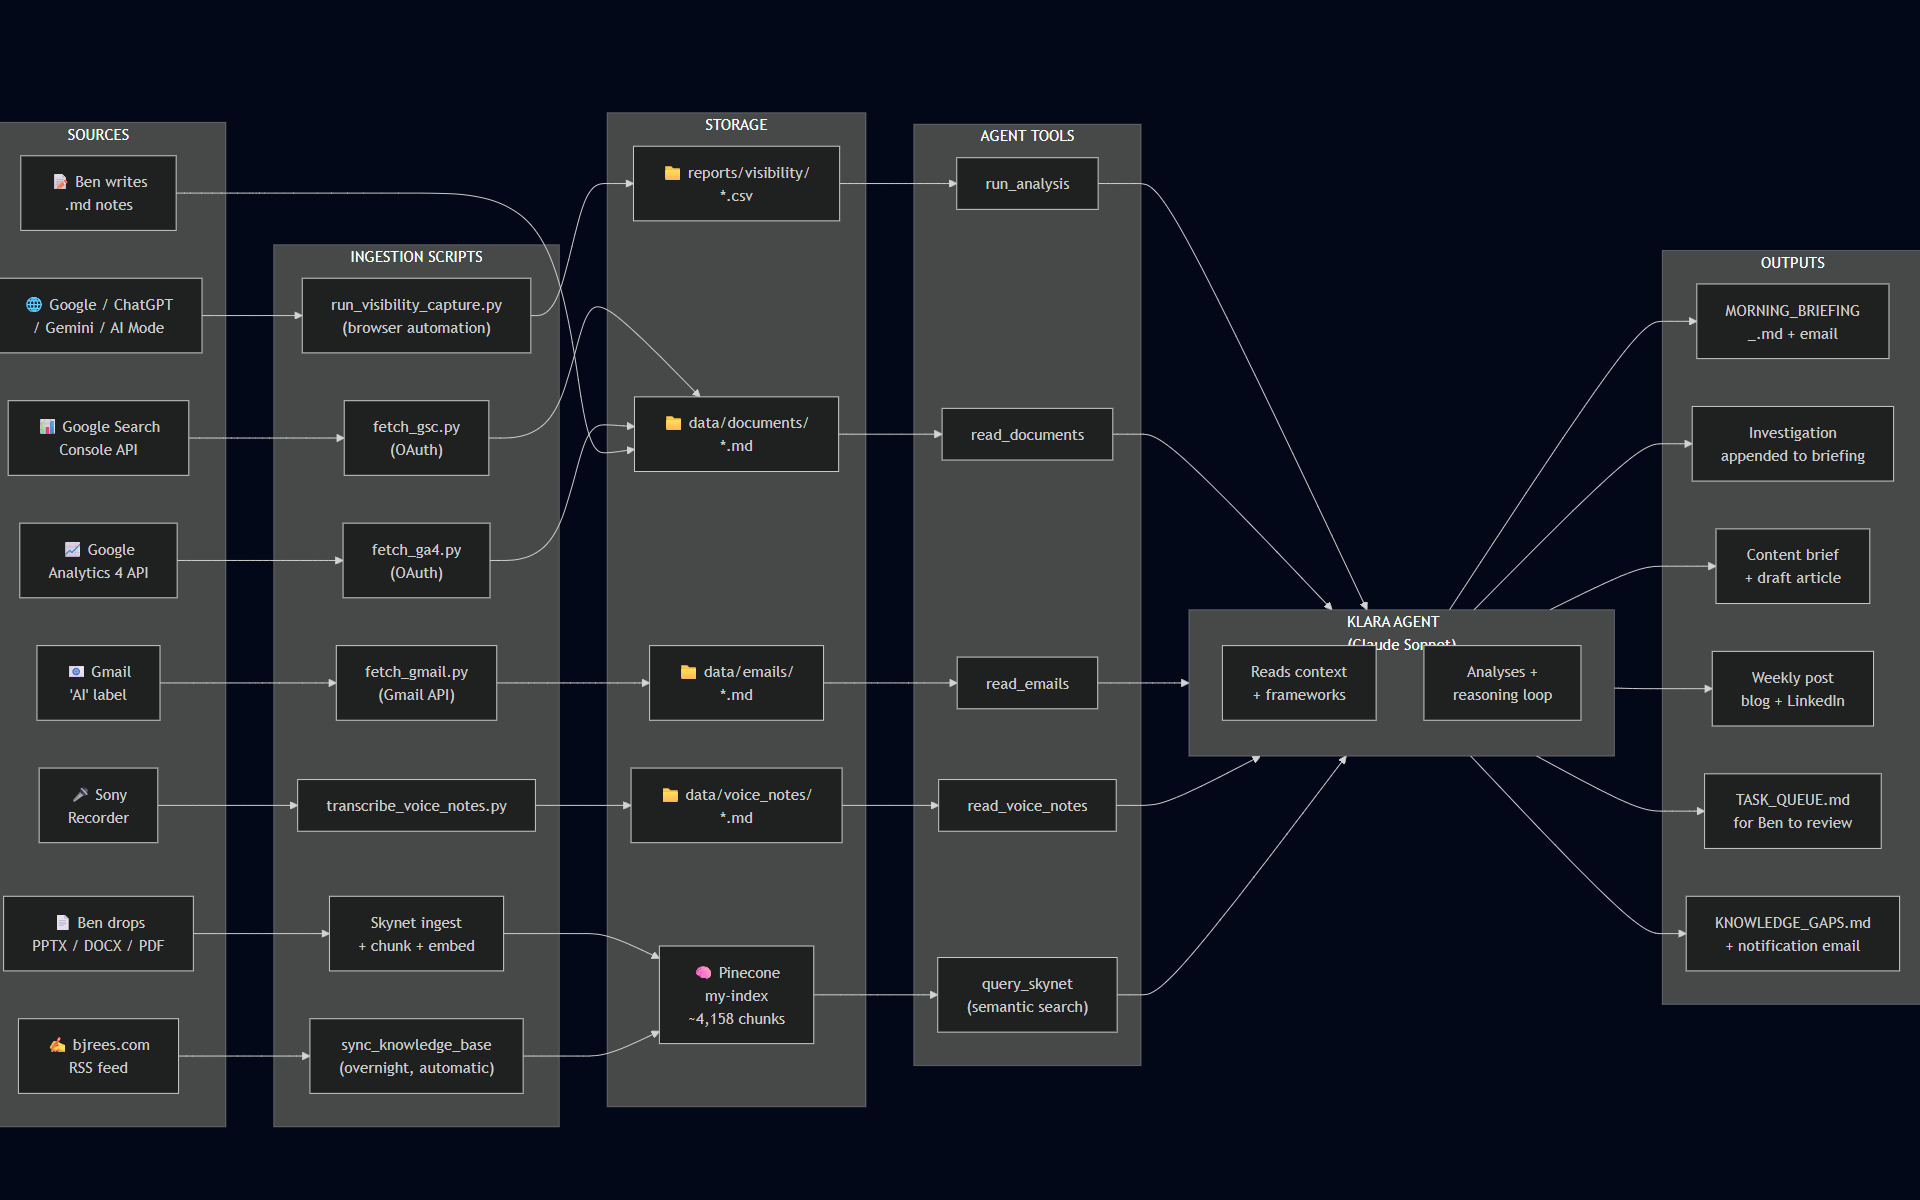
The diagram at the top shows how information flows through the system. There are three stages: ingestion, processing, and output.
Ingestion is where raw data enters from eight different sources (for now…):
- The browser captures themselves – Yes/No/Error per query per platform
- Google Search Console, pulled via API, showing organic search performance
- Google Analytics 4, also via API, showing traffic patterns
- My Gmail inbox, filtered to an “AI” label where I drop relevant reading
- Voice notes from my Sony recorder (https://www.sony.co.uk/digital-voice-recorders/voice-memo-recorders), transcribed automatically
- Documents I drop in manually – academic papers, strategy notes, my own frameworks
- Blog posts from bjrees.com, pulled automatically via RSS
- Presentations and research papers I’ve built up over the years, from companies where I’ve worked, anonymised
Processing is where Claude (the AI model I use for the agent) reads all of that, applies my frameworks, and synthesises it into something useful. It doesn’t just report numbers – it investigates gaps, cross-references my knowledge base, and tries to identify whether a visibility drop is a real pattern or a one-off.
Output is a morning briefing, emailed to me. Plus, on nights when there’s enough to say, a content brief, a draft article, and a weekly post for LinkedIn.
The thing I didn’t expect
When I mapped this out properly – which I only did recently, after it had been running for a few months – I realised how many layers there are beneath each headline input.
The “documents” input, for example, isn’t just one thing. It’s academic papers from Cambridge University Library, my own slide decks from a decade of B2B marketing roles, blog posts I’ve written, and live data pulled fresh from Google’s APIs. Some of it is text I’ve read and saved. Some of it is generated automatically overnight without me touching anything.
The key distinction in how the agent uses it: flat files get read directly, as text. Everything else – presentations, PDFs, the 131 blog posts on this site – gets broken into chunks, converted to vectors, and stored in a database (Pinecone) that the agent can search semantically. That means it can find relevant content based on meaning, not just keywords.
This is what makes the morning briefing actually useful rather than just a summary of numbers. When the agent investigates why I’m invisible for “who coined the term GEO?” – a query I might win one day 🙂 – it can search my knowledge base, find the relevant sections of my GEO whitepaper, cross-reference the GSC data, and produce a specific hypothesis with specific actions. Not generic advice.
What this is really an example of
I think this is what useful AI looks like in practice – not a chatbot you talk to occasionally, but a system that runs in the background, pulls from multiple data sources, and produces something actionable while you sleep.
The architecture isn’t complicated. The ingestion pipelines are mostly straightforward scripts. The hard part was being clear about what questions I wanted answered, and making sure the right information was available to answer them.
If you’re thinking about building something similar – whether for AI visibility measurement or for anything else where you need an agent with good context – the diagram above is a reasonable starting point. The three stages (ingestion, processing, output) apply to almost any agentic system. The detail is in what you put into each stage.
The diagram was produced using Mermaid.